The Importance of Upset Scenario Selection When Evaluating Reactive Hazards & Calculating TMR

Evaluating chemical hazards is a crucial part of plant safety. Any chemical process should be robust by design; any given process can be subject to reasonable changes. A robust design should accommodate small changes without a catastrophic consequence. To develop an inherently safe process, hazards need to be identified and evaluated in order to either prevent, mitigate, or eliminate them.
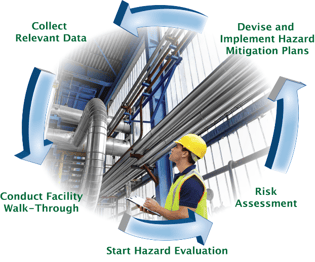
Reactive hazards are a special subset of chemical hazards that can be present whether the reaction is intended or not, and the results can have catastrophic consequences such as explosion, fires, or harmful chemical releases. It can be difficult to predict the outcome of a chemical reaction, particularly when the reaction is not intended. Nevertheless, it is critical to study both desired reactions in addition to these undesired reactions to ensure that the proper safeguards, procedures, or safety related equipment are installed to protect during them. There are many potential situations that can result in an unintended chemical reaction. These situations that lead to a chemical reaction are often referred to as “upset scenarios.” An upset scenario is a plausible abnormal process variation that is typically identified through a detailed process hazard assessment (PHA). Common upset scenarios include:
- Loss of Cooling During the Normal Process
- Fire exposure or Inadvertent Heating
- Wrong Reagent Addition or Order of Additions
- Excess Catalyst or Reagent
- Contamination
Oftentimes, multiple upset scenarios are possible, and it is important to make decisions regarding safety considering the scenario that would result in the most severe consequences.
This article will showcase the importance of selecting the worst-case upset scenario by comparing a critical safety parameter, adiabatic time-to-maximum rate (TMR) for three different upset scenarios.
Contaminated Hydrogen Peroxide Adiabatic Calorimetry Data
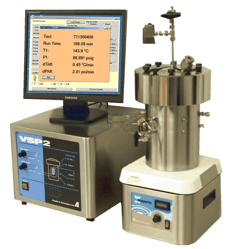
Studying the severity of a chemical reaction (whether intended or not) can easily be done in the VSP2 or ARSST. The VSP2 and ARSST are robust low phi factor adiabatic calorimeters, that can be used to directly and quickly simulate identified upset scenarios and provide directly scalable data.
In this example, a PHA identified iron contamination as a potential upset scenario for a facility that utilizes and stores 25% aqueous hydrogen peroxide. It is important to have a basis for the selected upset scenario, and to select proper safety measures to handle the worst-case credible scenario. The evaluation identified multiple scenarios that could result in iron contamination with possible concentrations in the range of 10 to 500 ppm.
 A series of open system (i.e. the test cell is open to a larger but closed containment vessel) VSP2 experiments were conducted with various levels of iron contamination. Note, the backpressure of the experiments varied between 0 psig and 110 psig. These corresponding backpressures affect the peak temperature achieved during testing due to the vaporization of water. Figure 1 provides the temperature rise rate vs. temperature data for the three experiments. The markers show the regressed data, and the solid lines show the exponential fit used to extract the thermokinetic parameters. Note, the kinetic fit shown in Figure 1 is not phi-corrected.
The provided data are based on a 7 point regression of the collected data, and the contaminant utilized was ferric sulfate hydrate. The test cells utilized were glass‑lined stainless steel (VSP2), and the approximate phi-factor for the experiments was 1.15. The VSP2 experiments were conducted utilizing a heat-wait-search methodology with an exothermic detection criterion of 0.2°C/min. As expected, the reaction onset decreases as contamination level increases with the decomposition of the hydrogen peroxide readily occurring even at room temperature when the contaminant concentration is 500 ppm.

Adiabatic Time-to-Maximum Rate
The collected data can be utilized to evaluate a number of critical process safety and thermal stability parameters (e.g. ideal vent requirements, adiabatic time-to- maximum rate evaluations, or self-accelerating decomposition temperatures). Time-to-Maximum Rate (TMR) information is an important quantitative criteria that can be used to describe the temperature and time pairings when a material(s) becomes thermally unstable. Essentially, TMR indicates the time it takes for a reaction to reach its maximum rate of heat generation for a specific starting temperature. An adiabatic TMR value is one where no heat is transferred between the system and the surroundings; i.e. the total heat generated from the reaction increases the temperature of the system and therefore increases the rate of reaction. TMR is a useful parameter when evaluating the probability of a thermal risk, and it can be used to better understand safe operating or storage conditions when performing risk or hazard assessments.
The data obtained from VSP2 testing can be used to assess this critical safety parameter. The first step is to determine an Arrhenius expression describing the temperature rise rate as a function of temperature. The temperature rise rate for reactions at low levels of conversion can be expressed by the zero-order Arrhenius expression provided by Equation 1‑1.

Note, this simplification is not well suited for higher order reactions, multi-step reactions, or reactions that display autocatalysis. At low levels of conversion temperature rate data can be corrected for the thermal inertial of the system simply by multiplying by the phi-factor.

The phi-factor is described by Equation 1-3.

Once the key kinetic parameters are determined, the adiabatic time-to-maximum rate can be estimated over a range of temperatures using Equation 1-4.

The summary of the tested scenarios and the temperature corresponding to a 24 hour time-to-maximum rate is available in Table 1.

Summary
The various sets of data were evaluated to determine the temperature corresponding to a 24 hour time‑to‑maximum rate. This value is commonly accepted as a critical safety limit at industrial scale. The results show that the temperature corresponding to 24 hours to the maximum rate decreases as the contaminant level increase. These results would imply significantly different safe storage or operating conditions for a contaminant level of 500 ppm vs. 10 ppm, for example. It is therefore important to consider the worst-case scenario when evaluating reactive hazards.
Contact us today for help identifying potential upset scenarios, and for guidance on establishing these critical safety parameters.
