By: Ashley Foote, Plant Services Engineer, Fauske & Associates
Introduction
Thermography is used in a wide variety of industries. At Fauske & Associates (FAI), it is primarily used in support of the nuclear industry during Cable Health and Aging Management Program (CHAMP) walkdowns to analyze suspected high temperature exposures. CHAMP walkdowns are visual inspections performed to assess adverse environments that may have unintended effects on safety related cables. This process utilizes thermography to identify locations where cables are experiencing high levels of heat exposure. This is beneficial because it is both the safest and simplest way to analyze the temperature conditions while a plant is at power; this holds true for any type of operating plant, not just nuclear plants.
What is Thermography?
Infrared thermography is the process of using thermal imaging cameras to analyze temperature profiles. Infrared cameras see the difference of temperature of objects in the frame. It is important to note that the temperature difference measured is for the surface of the objects and not for the inside of the object. Every surface absorbs, reflects, and transmits the infrared energy it is exposed to. This leads to the following equation:
WAbsorbed + WReflected + WTransmitted = 1
Where WAbsorbed, WReflected, and WTransmitted are the ratios of the absorbed energy to total exposure, reflected energy to total exposure, and transmitted energy to total exposure, respectively. The absorbed energy is related to the emissivity of the object and at equilibrium they can be assumed to be equal. The emissivity is the ratio of the actual surface emission to a perfectly emissive surface (where emissivity equals 1). The Stephan-Boltzmann law describes the relationship between energy emitted and the temperature of the object:
W=eσT4
Where e is the emissivity, σ is the Stephan-Boltzmann constant (5.67X10⁻⁸ Wm-2K-4), T is the temperature (in Kelvin), and W is the energy emitted from the object. Infrared cameras see the total radiation of the object and not just the emitted energy. This makes it important to input the correct emissivity of an object so that the amount of reflection can be eliminated from the final results. Typically, the less shiny an object is the more emissive it is.
How do we use Thermography in the Field?
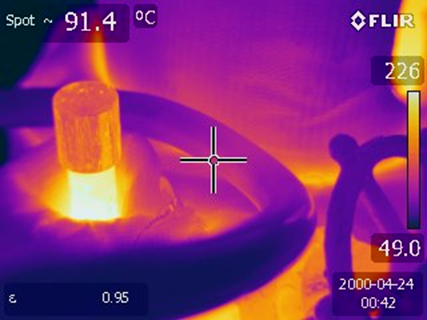
In the nuclear industry, CHAMP walkdowns are completed to meet the guidance presented in Generic Aging Lessons Learned (GALL) Report, NUREG-1801, Section XI, E1. This guidance is meant to assist with the license renewal process that all nuclear power plants must go through if they want to extend the operating life of their plant. One type of adverse environment identified during CHAMP walkdowns is localized high temperature areas. Cables are installed to meet the expected temperatures in the area; however, there are scenarios where the local temperature can be higher than expected. These high temperature areas can be caused by various circumstances; including loose or missing insulation, uninsulated components that are connected to hot components (i.e. metal valves exposed to air that are connected to an insulated, hot pipe line), or localized high temperature areas that are higher than the general room temperature. Figure 1 shows an example of a cable run near an uninsulated hot component. It shows that though the valve is mostly insulated, there is a portion sticking out of the insulation leading to an increased temperature exposure of the cable.

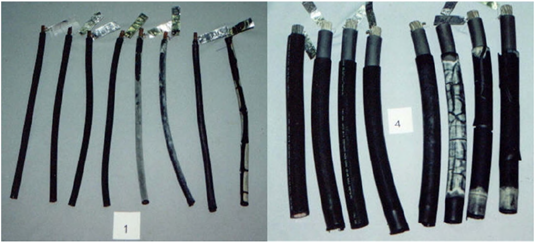
It can be difficult to identify adverse temperature areas visually. Figure 2 shows examples of cable that has visible signs of temperature damage. In the plants, many of these cables would be covered in metal conduit that would make it almost impossible to see damage. Without being able to see the physical signs of temperature degradation, one will have to identify all possible causes of increased temperature and then diagnose the chance of there being actual damage. Thermography allows for diagnosis of these situations very efficiently and also eliminates all of the guess work involved.

In addition to making the identification of high temperature areas more accurate, thermography also allows for safer work within a nuclear power plant. This is achieved by reducing dose exposure in two ways. The first way thermography reduces dose exposure is by significantly reducing the time a worker needs to be in the adverse area to diagnose the situation. Thermal cameras allow the workers to take multiple images of the component in question quickly and to analyze the images later while in a safer environment. The second way that thermography reduces dose exposure is by allowing workers to be further away from equipment they are analyzing. The further they are from radioactive equipment, the smaller the dose rate will be. Without thermography a worker may have to get very close to an object to look for visual hints of heat damage or to apply temperature monitoring equipment.
Additional Benefits of Thermography in the Field
Many industries benefit from the advantages of using thermography in the field. Thermography is often used to find faults in electrical systems without having to stop power to the system itself. This can be extremely beneficial for companies without the capacity to shut down systems for days at a time while troubleshooting issues. The ability to analyze thermal patterns without having to open junction boxes or physically touch the system makes it significantly safer for electricians to solve problems. The building industry uses thermography to detect moisture leaks, missing or failing wall insulation, and structural damage. Similarly, there are many mechanical applications for thermography, such as analyzing the functionality of heat exchangers, valves, engines, tanks, piping systems, and air handling systems. FAI is working to expand the use of thermography in the field to support equipment qualification tests, dust hazard analysis (DHA) projects, and other areas where it may provide additional benefits.
References
NUREG-1801, “The Generic Aging Lessons Learned (GALL) Report”
Incropera, Dewitt, Bergman, and Lavine. “Fundamentals of Heat and Mass Transfer Sixth Edition,”John Wiley & Sons, 2007.
For more information, contact Ashley Foote, Plant Services Engineer, (630) 323-8750, foote@fauske.com. www.fauske.com

