
Wison Luangdilok, PhD, Senior Consulting Engineer, Fauske & Associates
ABSTRACT
The explosions at Fukushima Daiichi accidents are investigated and discussed, in particular the least well-understood explosion at unit 3. An analysis was performed to estimate the amount of hydrogen burned in the unit 3 explosion to shine light on the pre-explosion conditions. This amount was estimated to be more than 10 times the amount burned at the unit 1 explosion. A significant level of understanding of the explosions and the required conditions has been achieved in this investigation that can help prevent or mitigate such future explosion events during a severe accident in boiling water reactors. This article presents some of the contents that was first presented at the Reactor Safety Technology Expert Panel Fukushima Daiichi Accident Forensics Meeting, November 18-19, 2019 at Argonne National Laboratory Offices in Washington, D.C.
1. INTRODUCTION AND BACKGROUND
During the nuclear accidents that started at 2:46 pm on March 11, 2011 when the 15-meter high tsunami waves hit the Fukushima Daiichi nuclear power station site that caused an extended station blackout over several days, three reactors at Units 1, 2, and 3 eventually underwent a core meltdown.
There were three separate explosions initiated from the top floor of the reactor building of Unit 1 (1F1), Unit 3 (1F3), and Unit 4 (1F4) at 3:36 pm on March 12, 2011, 11:01 am on March 14, 2011, and 6:14 am on March 15, 2011, respectively (Japanese Government, 2011). There was no explosion at Unit 2 (1F2). The explosions at Unit 1 and Unit 3 were caught on video cameras (with no sound recorded) by television stations from a far distance that gives the overall picture of the dynamics of the explosions. If there were no such videos it would have been impossible to know that the explosion dynamics of 1F1 and 1F3 were very different (as depicted in Fig. 1).
The explosion dynamics of 1F4 remains unknown since there was no video capture of the 1F4 explosion at the time when it happened. One interesting twist is that, according to the TEPCO investigation, the migration of hydrogen in vented gas from Unit 3 to Unit 4 through the connected vent lines to the same shared vent stack during the venting of Unit 3 was responsible for supplying fuel to the 1F4 explosion (Rempe et al., 2017). It is believed that the potential explosion at 1F2 was averted due to two reasons. First, the pressure wave from the 1F1 explosion caused the 1F2 reactor building top-floor blowout panel to open allowing accumulated hydrogen to vent out of the building (Rempe et al., 2019). Second, due to the unique situation at 1F2, the steam, generated from the 1F2 reactor building bottom floor torus room that was partially flooded by the tsunami (NEA, 2015), helped render inert the supposedly flammable mixture (Sonnenkalb et al., 2019). Based on the current understanding and the pattern of the occurrences, an explosion from the top floor of the reactor building has become a unique signature of a severe reactor core meltdown accident in a boiling-water-reactor (BWR)-type nuclear power plant.
Many questions regarding how the explosions occurred and how they can be related to what was going on inside the reactor (in-vessel hydrogen generation) and inside the primary containment vessel (PCV) (ex-vessel hydrogen generation) have been discussed with no clear answers (Rempe et al., 2017, 2019). The types of questions that have been asked by experts include (1) where and how did the ignition occur, (2) did hydrogen leak into the reactor building through degraded seals on the head of the PCV, (3) what level of hydrogen accumulation and pre-explosion conditions are needed to cause the observed damages from the explosions, (4) what type of pre-explosion conditions were necessary to cause the 1F3 explosion to be a mushroom-shaped fireball which was much more energetic than the 1F1 fast-deflagration-type explosion (Yanez et al., 2015), (5) what was the role of PCV head failure in the 1F3 explosion, and (6) how much in-vessel and ex-vessel hydrogen generations are needed to fuel both the 1F3 and 1F4 explosions given the fact that the 1F3 explosion alone was so spectacular in displaying the powerful mushroom-shaped fireball that would have involved a huge amount of hydrogen by itself (Rempe et al., 2019).
The dynamics of the explosion can be linked to the necessary pre-explosion conditions which can be further linked to the extent of in-vessel and ex-vessel hydrogen generation required to fuel the explosions through core-melting phenomena over the course of the accident. The dynamics of the 1F3 explosion was very different from the 1F1 which indicates that the pre-explosion conditions were likely very different. The explosion in Unit 1 was directed horizontally from the top floor of the reactor building. Building roof and sidings were blown away by the explosion but concrete pillars remain intact with little damage. The explosion in Unit 3 was much more energetic based on the severity of building damage. The combustion process of the explosion at 1F1 was a fast deflagration of premixed hydrogen accumulated in the operating bay (5th floor) of the reactor building. A video of the explosion indicates the presence of a condensation shock wave (for about a 0.5-second duration) propagating into an open air at about the speed of sound after the initial bursting of the 1F1 reactor building. The deflagration was not fast enough to transition to detonation. The explosion “smoke” at about one second after the initial bursting appeared light in color, suggesting it was primarily dust. The “smoke” was dispersed relatively close to the building in the vertical direction and was directed northward due to the prevailing wind at that time.
The explosion at 1F3 was a multi-mode combustion. There appeared to be at least two modes of combustion involved in the explosion. The first mode was probably a deflagration, but, of hydrogen (and possibly CO)-rich atmosphere accumulated in the operating bay 5th floor. This first mode of combustion occurred inside the reactor building and could not be seen in the available video until the initial bursting of the 1F3 reactor building. Following the bursting of the 1F3 reactor building, the top floor of the reactor building became roof-less, and the second mode of combustion began in an open air on top of the reactor building. The second mode was combustion of a hydrogen (and possibly CO)-rich gas cloud in an open air in the form of a rising and expanding spherical fireball over the reactor building. Large objects were thrown high into the sky with the rising fireball. Big pieces of concrete and equipment were also thrown into the spent fuel pool. The fireball reached a large diameter of ~120 m within 3 seconds. The dynamics of the 1F3 explosion is depicted by a sketch in Fig. 2.
The second mode of combustion was directed vertically with an almost perfect spherical fireball appearing above the building and shooting up high into the sky (about three times the vent stack height). Large chunks of materials appeared to be carried upward with the fireball. Unlike the explosion at 1F1, the available images of 1F3 explosion damages indicate that concrete pillars on the building top floor were highly damaged. The “smoke” resulted from the fireball appeared in darker color of dust and debris than that of the first combustion mode, which appeared white and remained at lower elevations close to the building.

Fig. 1 Hydrodren Explosions during Fukushima Daiichi Accident

Fig. 2 Sketches of 1F3 explosion at 1-second intervals from real images
The fact that the 1F3 explosion was much more powerful than the 1F1 explosion requires that the amount of combustible gases involved in the entire explosion must also be much greater. In the 1F1 explosion, the deflagration apparently burned the entire combustible gas-air mixture that initially existed in the 5th floor of the reactor building. In the 1F3 explosion, a similar deflagration of initially existed combustible gas-air mixture is postulated since this mode of combustion could not be seen in the video until the initial bursting of the 1F3 reactor building. It is then expected that if most of the combustible gas mixture were to be consumed in the first deflagration, the explosion would have been over. However, this is not the case for the 1F3 explosion. Following the bursting of the reactor building, there was a huge fireball burning immediately over a period of about 9 seconds over the reactor building. For this to happen, there must have been still a large amount of unburned combustible gases (which did not exist in the 1F1 explosion) ready to fuel the fireball.
There is a question that has been discussed often among severe accident experts (Rempe et al., 2019). Can the abrupt PCV depressurization (which is believed to be a result of PCV upper head seal failure) before and during the time of explosion provide the necessary fuel? The time of the 1F3 explosion was within the time frame when the 1F3 PCV pressure began to drop significantly from about 0.52 to about 0.39 MPa. From 10:55 to 11:02, about 6 minutes prior to the explosion, the drywell pressure dropped from 0.52 MPa to 0.48 MPa. The average depressurization rate for this 6-minute duration prior to the explosion was 95 Pa/second. The 1F3 explosion lasted for about 9 seconds, the total pressure drop of just 885 Pa is too little to fuel the observed gigantic fireball. Then, after the explosion from 11:02 to 11:15 am, the drywell pressure continued to drop further from 0.48 MPa to 0.39 MPa. The average depressurization rate for this 13-minute duration after the explosion was 115 Pa/second. However, the post-explosion PCV depressurization had no role in fueling the explosion.
This article analyzes the explosion that occurred at Fukushima Daiichi Unit 3 with the goal of estimating the amount of hydrogen gas burned during the explosion. The current understanding is that hydrogen gas generated from Unit 3 fueled the explosions both at Unit 3 and Unit 4 and that hydrogen gas was generated by both in-vessel metal oxidation and ex-vessel core-concrete interactions. The combustion mode of the 1F3 explosion has remained not well understood and the key to understand this is to know the amount of hydrogen burned in the explosion. If the amount of hydrogen burned in the explosion can be estimated, a better understanding of the explosion mechanism can be achieved.

2. ESTIMATE OF HYDROGEN BURNED IN THE 1F3 EXPLOSION
In the realm of hydrocarbon fuel explosion research, there is a relatively accurate method that relates the size (radius) of the spherical fireball to the fuel mass burned (Fig. 3). The correlation for the maximum fireball radius R (in meter) as a function of hydrocarbon fuel mass Mhc in metric ton can be conveniently expressed by the following equation that represents the detonation mode explosion (Dorofeev et al., 1995):
R=33 Mhc0.32
(1)
Here, the hydrocarbon fuel refers to gasoline, kerosene, or diesel fuel. The heats of combustion per kilogram of these hydrocarbon fuels are actually very close to one another. The average value of the heat of combustion of these fuels is 43.11 MJ/kg.
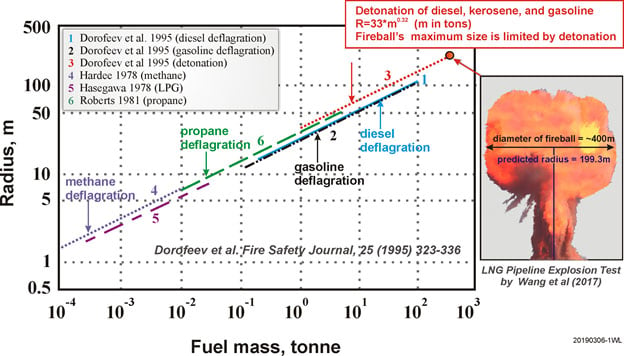
Fig. 3 Maximum fireball radius formed in an explosion of hydrocarbon fuel-rich clouds
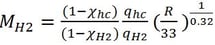
The accuracy of applying the correlation for hydrocarbon fuel to hydrogen fuel is unknown. In order to deal with fuels with a significant difference in the value of the heat of combustion, the maximum fireball radius should be expressed in terms of the total combustion heat released rather than the fuel mass. Equation (1) can be recast in term of the total combustion energy released that remains in the fireball as follows (Luangdilok, 2019):
.jpg?width=290&name=eq%202%20(002).jpg) (2)
(2)
where qhc is the average heat of combustion of hydrocarbon fuel (43.11 MJ/kg), Xhc = fraction of radiative heat loss from the hydrocarbon flame, qH2 is the heat of combustion, and MH2 is the mass of hydrogen burned. This equation represents the maximum fireball radius due to a detonation-mode fireball explosion as a function of the fuel mass.
For 1F3 explosion, the fireball radius R is determined from video snapshots depicted in a sketch in Fig. 2. The mass of hydrogen burned is given by solving Eq. (2) for MH2 (metric ton)
(3)
The fraction of radiative heat loss from the hydrocarbon fireball can be calculated from a fuel mass using the Dorofeev et al. (1995) correlation which can be derived as
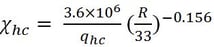
(4)
The radiative heat losses from methane jet flames and hydrogen jet flames originated from a nozzle were extensively investigated by Molina et al. (2007). For a wide range of flame length and fuel jet velocity, the fraction of radiative heat loss from the hydrogen fireball is approximately 0.03 smaller than that of the methane flame, i.e. XH2 = Xhc - 0.03.
Next, the right size of the near-perfect spherical fireball needs to be determined. For this purpose, the fireball radius of 53.125 m is selected as the best estimate value. This particular moment of the near-perfect spherical fireball occurred between the snapshots shown in Fig. 2 at 1 and 2 seconds. The fireball at the 1-second snapshot was approaching a fully-grown spherical shape while at the 2-second snapshot the fireball is already fully grown and slightly elongated into an ellipsoidal shape. It is noted that the analysis of the fireball shape and size is based on the actual high-resolution photos that are not provided here. The right fireball size is assumed to be in the middle between these two snapshots. Using qhc= 43.11 MJ/kg, qH2=120 MJ/kg, R=53.125 m, the radiative heat loss fraction from Eq. 4 is 0.0775, and the mass of hydrogen burned at the 1F3 explosion is estimated from Eq. 3 to be ~1540 kg. This estimate is sensitive to the size of the fireball chosen and the uncertainty associated with this estimate is in the range of ![]() 250 kg which is approximately the range between the fireball size at 1 and 2 seconds.
250 kg which is approximately the range between the fireball size at 1 and 2 seconds.
3. DISCUSSION OF THE 1F3 EXPLOSION
The formation of a rising fireball during an explosion is typical of combustion conditions where a release of fuel and ignition occur simultaneously (Dorofeev et al., 1995). The combustible gases are not well mixed with the air at the time of ignition. The gases continue burning as they mix with ambient air. The rising fireball forms. Then, a strong convective column (as seen in the 1F3 explosion (Fig. 2) and in the LNG pipeline explosion test (Fig. 3) by Wang et al. (2017)) is formed below the rising fireball.
Alternatively, a rising fireball can also be developed after the explosion of over-enriched fuel-air mixtures when the explosion products, still containing a great amount of fuel, continue to burn with the ambient air. These two modes, including a combination of both, have been used as possible explanations for the 1F3 explosion. A discussion given below provides a basis to determine which one is the likely one.
The analysis result indicates that a large amount of hydrogen or hydrogen equivalent must be involved in the 1F3 mushroom-shaped fireball explosion. However, the required amount of hydrogen in the explosion is too large to be released during the fire-ball explosion which occurred over a duration of just 9 seconds. The result suggests that the likely combustion mode for the 1F3 explosion was that a large amount of unmixed hydrogen-rich gases leaked and filled the atmosphere of the reactor building 4th and 5th floors at ~75% H2 concentration prior to the explosion. There was a direct release of some hydrogen gas during the explosion as a result of the PCV depressurization, but this additional source is not substantial since the total required amount of hydrogen or hydrogen equivalent is huge.
4. CONCLUSION
The huge mushroom-shaped fireball explosion at the Fukushima unit 3 was likely a manifestation of an accumulation of a large amount of unmixed hydrogen-rich gases that leaked and filled the atmosphere of the reactor building 4th and 5th floors during the accident at ~75% H2 concentration prior to the explosion. The amount of hydrogen burned in the unit 3 explosion was estimated to be more than 10 times the amount burned in the unit 1 explosion, i.e. 1540 kg vs 130 kg (Yanez et al, 2015).
For more content like this, subscribe to our nuclear technical bulletin. Our "Nuclear Technical Bulletins" are a forum on recent advances in nuclear safety. It addresses subscriber’s concerns regarding issues, practices and latest laboratory equipment used for emergency relief system design, plant safety and more.

REFERENCES
Dorofeev, S.B., et al., 1995, Fireballs from Deflagration and Detonation of Heterogeneous Fuel-rich Clouds, Fire Safety Journal, 25, 323-336.
Japanese Government, 2011, Report to the IAEA Ministerial Conference on Nuclear Safety, The Accident at TEPCO’s Fukushima Nuclear Power Station.
Luangdilok, W., 2019. How much was hydrogen burned in the 1F3 explosion? NURETH-18 Proceedings, Portland, Oregon, 3464-3472.
Molina, A., Schefer, R.W., Houf, W.G., 2007, Radiative fraction and optical thickness in large-scale hydrogen-jet fires. Proc. of the Combustion Inst. 31, 2565–2572.
NEA, 2015, Benchmark Study of the Accident at the Fukushima Daiichi Nuclear Power Plant (BSAF Project) Phase 1 Summary Report, NEA/CSNI/R(2015)18
Rempe, J., Corradini, M., Farmer, M., Gabor, J., Gauntt, R., Hara, T., Luangdilok, W., Lutz, R., Luxat, D., Mizokami, S., Robb, K., Plys, M., Tateiwa, K., Yamanaka, Y., 2017, Safety Insights from Forensics Evaluations at Daiichi. J. Nucl. Mater. and Energy 10, 18-34.
Rempe, J. ed., 2019, US Efforts in Support of Examinations at Fukushima Daiichi 2019 Evaluation, prepared for US Department of Energy. ANL/LWRS-19/08, August.
Sonnenkalb, M., et al., 2019, Overview and Outcomes of the OECD/NEA Benchmark Study of the Accident at the Fukushima Daiichi NPS (BSAF), Phase 2 – Results of Severe Accident Analyses for Unit 2, NURETH-18 Proceedings, Portland, Oregon, 1119-1132.
Wang, K., Liu, Z., Qian, X., Huang, P., 2017, Long-term consequence and vulnerability assessment of thermal radiation hazard from LNG explosive fireball in open space based on full-scale experiment and PHAST. J of Loss Prev. in the Proc. Indus. 46, 13-22.
Yanez, J., Kuznetsov, M., Souto-Iglesias, A., 2015, An analysis of the hydrogen explosion in the Fukushima-Daiichi accident. Int. J. Hydrogen Energy 40, 8261-8280.