Non‐destructive Examination (NDE) Testing Electric Cables using LIRA®
OVERVIEW
Electric cables are essential to all industrial processes. They serve several functions, including power supply, instrumentation and control. Despite their importance, cables typically receive little attention — they are considered passive, long-lived components that are very reliable. However, cable failures have caused safety concerns and resulted in accidents, lost revenue, and even plant shutdowns.
The key component of a cable’s construction is the insulation material around the metallic conductor. The insulation is the material, located inside the jacket (or outer material) of the cable. Depending on the voltage and application, cable construction can also include other components such as shields and semiconductor tape.
Cable reliability is a growing concern in industry, particularly for nuclear power plant life extensions where aging has become a factor for cables in safety-critical applications. This issue is discussed in the Nuclear Regulatory Commission (NRC) report Generic Aging Lessons Learned (NUREG 1801). Cable aging continues to be an important research topic for the NRC and EPRI. A key question for operators is, how can we evaluate cable health based upon nondestructive field measurements?
There are several test methods available to evaluate cable performance. Some methods stress the cable beyond their normal operating conditions — sometimes to failure. Other methods provide an indication of the overall performance of the cable, but do not identify localized damage.
The LIne Resonance Analysis (LIRA®) cable condition monitoring test provides both an indication of the overall cable health and as well as locally degraded areas. It is a NDE tool that does not over-stress the cable; it uses a relatively low 5 volt peak-to-peak (Vpp) signal to perform its evaluation. It performs both global and local assessments of the test cable. Importantly, the test cable does not need to be disconnected from its source and testing is completed in minutes. Leaving the cable connected eliminates a potential problem source: the cable termination.
HOW DOES LIRA® WORK?
LIne Resonance Analysis is based on transmission line theory. A transmission line can be viewed as any two conductors with an applied voltage. A good example of a transmission line is overhead cables which transmit power from a generator to various loads. This definition also applies to a coaxial cable as well as two strips on a printed circuit board. LIne Resonance Analysis transmits a frequency modulated wave through the test cable and measures the impedance change of the insulation material. The magnitude of the reflected wave along with the phase shift of the wave are used to establish the overall health of the cable and identify locations where it has been locally degraded. This change in impedance can be the result of cable connections/splices or from damage to the insulation as a result of exposure to cable stressors. Cable stressors include: higher than normal thermal conditions, mechanical damage, radiation, and others.
LIne Resonance Analysis transmits a wave with a step change in frequency, thus a reflection will be found at each wave frequency. This process is commonly referred to as frequency domain reflectometry or FDR. The reflected wave will experience a phase shift which is a function of the wave frequency and distance to the change in impedance. Through frequency domain analysis, it determines the magnitude and location of changes in the cable’s insulation properties (due to cable stressors) along with the end termination of the cable. This information is then used to establish the overall health of the cable along with identification of locations along that cable that have been locally degraded. With this information, local cable repairs can be made — rather than requiring complete cable replacement.
In addition to localized insulation damage, LIne Resonance Analysis also provides an overall assessment of the cable’s global condition. This parameter, LIRA® Delta-G (LDG), is currently established as a measurement that provides an indication of the cable’s global health. With this information, a determination of the remaining cable life and hence if (and when) the cable will need to be replaced can be established.
TESTING
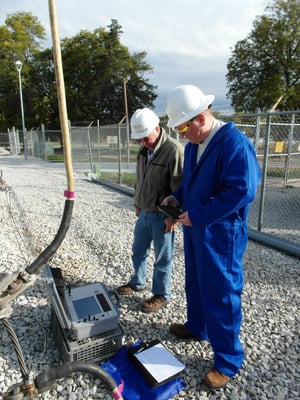
Testing a cable with LIne Resonance Analysis is quick and easy. All that is needed is for the cable to be deenergized (it does not need to be de-coupled) and then for the connection of two LIne Resonance Analysis tests leads to two metal cores of the cable (for example, two conductors or one conductor and a shield). Depending on the length of the test cable, a typical test will take about three minutes.
Figure 1: Testing of an underground electrical transmission circuit
 RESULTS – CABLE DEGRADATION
To assess cable degradation as a new parameter, the LDG parameter is age independent, and provides an evaluation of the remaining insulation life. The advantages of LDG compared to other test methods such as Tan δ (which uses very low frequency signals at, or typically above, operating voltages), include:
• LDG is applicable to all cable types: Low-, medium-, and high-voltage
• No stress to the cable (LIne Resonance Analysis uses relatively low 5-V signals)
Assessment of the effectiveness of the LDG test method has not been completed and more comparison tests with Tan δ are currently being performed.
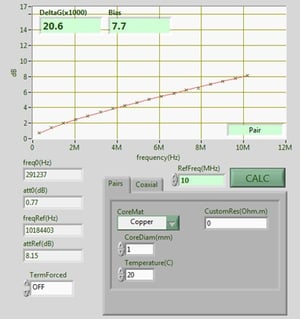
Figure 2: Delta-G (LDG) Evaluation
RESULTS – LOCAL DEGRADATION ASSESSMENT
LIne Resonance Analysis includes an algorithm to assess the severity of any local degradation affecting the local value of the cable impedance.
A normalized degradation parameter was developed called DNORM. The DNORM parameter (Fig. 3) can be used to categorize the degree of degradation and to determine whether an anomaly requires immediate action (or explanation). Furthermore, the sign of DNORM is used to detect the reason for the impedance change (e.g., thermal degradation, moisture penetration or other).
Figure 3: LIRA® DNORM Evaluation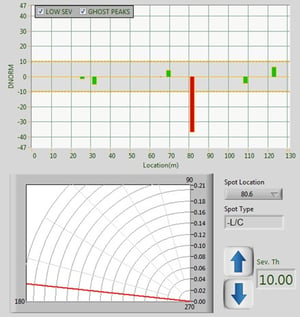
RESULTS – INSULATION DAMAGE LOCATING
The following are examples of LIne Resonance Analysis test results.
THERMAL STRESSOR: A 150 ft (46 m) long low voltage two conductor cable was tested with the LIne Resonance Analysis. This cable was located close to a high temperature heat source and has heat imposed damage to the cable insulation at 71 ft (22 m). Key test results are presented in the Signature plot, which is a normalized graph to account for the attenuation effects (increasing with the signal frequency). The Signature plot for this example is shown in Figure 4.
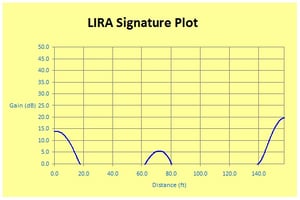
Figure 4: Signature Plot – Thermally stressed cable
The abscissa (x-axis) of the signature plot shows cable length with the test leads connected
at the origin. The test signal gain is shown on the ordinate (y-axis). The gain represents the power ratio (given in decibels) between the reflected and incident wave at each cable location. The magnitude of the LIne Resonance Analysis test signal provides information about the potential issues the cable has been exposed to. Typically, signature signals above an established threshold identify areas to be investigated. These signatures can be splices or insulation-degraded areas. For all LIne Resonance Analysis tests there are peak values associated with the signal passing through the cable at the entry and exit points. As shown in Figure 4, a signal spike occurs at 71 ft, which corresponds to thermal damage.
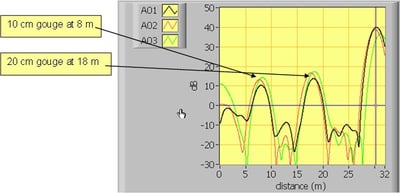
MECHANICAL STRESSOR: A 100 ft (30 m) 24 kV cable was tested with LIne Resonance Analysis. This cable had mechanical damage to the insulation at two locations: 26 ft (8 m) and 59 ft (18 m). The following picture (Fig. 5) shows the cable damage at 26 ft (8 m).
Fig. 5: 24kV cable with mechanical damage at 26 feet (8 meters)

As shown in the following Signature plot for all three phases of the cable (A01-A03), LIne Resonance Analysis identified both mechanically damaged locations.
Fig. 6: Signature Plot – Mechanically stressed cable
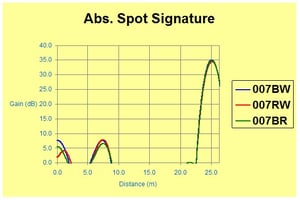
 RADIATION STRESSOR: An 82-ft (25 m) power cable was tested with LIne Resonance Analysis. This cable had localized gamma radiation damage at 24 feet (7.4 m). The following plot (Fig. 7) shows the identification of the localized radiation damage.
Fig. 7: Signature plot – localized gamma radiation stressed cable
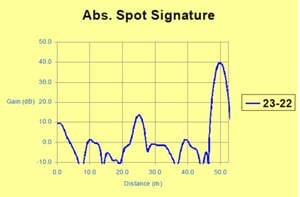
 SERIES CABLE WITH THERMAL STRESSOR: Two 82 ft (25 m) cables were connected in series. The first cable had thermal damage at 33 ft (10 m) and the second cable had thermal damage at 129 ft (39 m) when connected in series. The two cables were connected at 82 ft (25m). The following LIRA® plot (Fig. 8) shows the identification of both areas of damage along with the splice between the cables.
Fig. 8: Signature plot – two cables connected in series with thermal stress at 10.1 meters and 39.3 meters
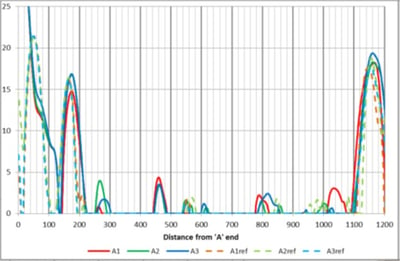
SPLICE LOCATION: A 3800 ft (1160 m) cable with multiple splices was evaluated to identify the location of the splices. All cable splices were located. The following plot (Fig. 9) shows the location of the splices. In addition, since multiple phases of the same cable were analyzed, an assessment of the condition of the splices was also performed.
Figure 9: Signature Plot – Splice location identification
For additional information, please contact info@fauske.com.
#electrical cable, #cable test, # thermal stressor, #non-destructive examination

