In the last newsletter we showed the tremendous amount of energy contained in a post epichlorohydrin (EPI) hydrolysis reaction mass. For our generic recipe (27.1% wt epichlorohydrin, 72.4 wt% water, 0.5 wt % acid catalyst [69% aqueous nitric acid]), the total adiabatic potential was +195.8°C as shown by reaction calorimetry and differential scanning calorimetry (DSC) which included intended reaction heat and higher temperature activated polymerization/decomposition heat. Ultimately, this total energy potential and the overlap, if any, between the desired reaction energy and the undesired polymerization/decomposition energy is to be confirmed by adiabatic calorimetry (Fauske VSP2) which will be the subject of the third part in this newsletter series.
Nevertheless, if one wanted to scale up this process, the management of the desired heat of reaction is crucial to process safety. While these reactions are easy to control in a laboratory reaction calorimeter via jacket cooling, just how easy is it to control with scale? Eventually, we will perform some simple calculations to show how these thermal challenges offered by the epichlorohydrin hydrolysis process would be handled at scale.
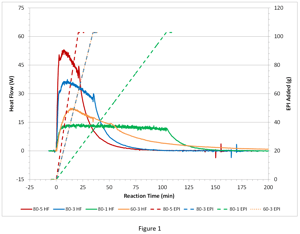
First, the full series of EPI hydrolysis reaction calorimetry (RC) experiments will be presented to get a feel for the kinetics of the semi-batch process as seen by the heat flow profile. Figure 1 shows a series of four reaction calorimetry runs covering three different addition rates of EPI (1, 3, 5 g/min) and two different temperatures (60°C, 80°C). Specifically, runs at 80°C with EPI feed rates of 1 g/min (80-1 HF), 3 g/min (80-3 HF) and 5 g/min (80-5 HF) and a run at 60°C with EPI feed rate of 3 g/min (60-3 HF) are shown. Also shown are the respective addition profiles. Table 1 summarizes the RC data derived from the four runs.
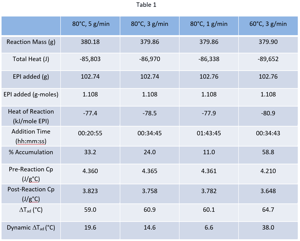
Out of the four sets of process conditions, not surprisingly, the lower temperature 60°C with 3 g/min feed rate results in the highest amount of accumulation (58.8%). That is, the largest amount of energy yet to come due to unreacted EPI after the end of the addition. Even at 80°C with a 1 g/min feed rate there is a slight accumulation of EPI, but only 11%. At 80°C, it is easily seen that the longer the addition the less accumulation, and the more the heat flow profile approaches an addition-limited profile (square-wave) where ultimately, the EPI would be reacting as soon as it is added.
Typically, in batch equipment one would rely on jacket cooling to remove the reaction heat and control temperature. If we scale our epichlorohydrin hydrolysis batch process to 2000 kg of EPI and run it in a 12,000-liter (diameter 2.4 m) reactor, the stirred volume for our generic recipe would be 7,250 liters corresponding to a heat transfer area of 15.1 m2 (A). If the tank was glass lined steel (GLS), a typical heat transfer coefficient (U) would be ~300 W/m2K. Assuming a maximum temperature difference between the reactor and jacket (DT) of 50°C, our maximum cooling capacity would be UADT = 300 x 15.1 x 50 = 226,500 W. For the 2000 kg EPI batch size, the normalized cooling capacity is 113.3 W/kg EPI.
If the reactor material of construction was Hastelloy C (HC), a slightly larger U could be applied (500 W/m2K). Similarly, then for the case of HC, the cooling capacity would be UADT = 500 x 15.1 x 50 = 377,500 W. For the 2000 kg EPI batch size, the normalized cooling capacity is 188.8 W/kg EPI. Please note that all the values assumed for the heat transfer coefficient are at the upper end of the performance range for each material of construction. Certainly, jacket fouling and choice of heat transfer fluid can affect these assumed U values, as well.
Figure 2 shows the now normalized (W/kg EPI) heat flow profiles for our series of four RC runs together with the normalized cooling capacities for the 2000 kg batch size at the 12,000 scale for glass lined steel (GLS) and Hastelloy C (HC) reactors.
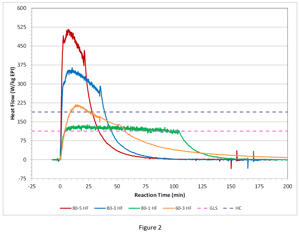 One can easily see that jacket cooling in either the glass lined steel reactor or Hastelloy reactor is inadequate for both the 80°C 5 g/min and 3 g/min cases as a significant portion of the heat flux profile exceeds the cooling capacity lines. While one may not run the process this way due to the large amount of accumulation (58.8%), one can see that the HC reactor is close to handling the 60°C, 3 g/min case, if the addition was longer, say > 1 hour. Similarly, the glass lined steel reactor is close to handling the 80°C, 1 g/min case if the addition was say, > 2 hours. Clearly, an extended, controlled addition of EPI is necessary to perform this process at scale.
In fact, an 80°C run with a 0.822 g/min addition (126 minutes) was done and the results are shown in Figure 3 (an updated version of Figure 2).
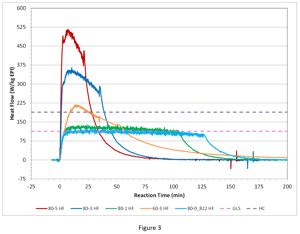
Indeed, with the greater than 2-hour EPI addition at 80°C, the resultant heat rate is at or below the cooling capacity line for the glass-lined steel reactor.
Relevant RC data (a lá Table 1) derived from the 80°C, 0.822 g/min run were total mass 379.8 g, total heat -91,578 J, EPI added 102.68 g (1.108 moles), heat of reaction -82.7 kJ/mol EPI, addition time 2:06:09, % accumulation 9.53%, pre-reaction Cp, 4.378 J/g°C, post-reaction Cp 3.819 J/g°C, projected adiabatic temperature rise +63.1°C, and dynamic DTad +6.0°C.
A couple of points should be emphasized when scale-up requires an extended addition for cooling capacity reasons. First, the inherent safety offered by an extended addition minimizing accumulation is only realized if in the event of the loss-of-cooling, the addition is stopped. Also, with extended additions, it is very important to perform a validation run using that projected addition time in the laboratory to make sure material of desired quality and purity is still made with the longer addition.
In summary, we hope this article has given the reader an appreciation for the challenges faced by scaling up the exothermic EPI hydrolysis process to manage the desired reaction energy while avoiding the secondary polymerization/decomposition. This is also an example of how RC data can be used to optimize a process. The data make it possible to determine the fastest practical addition rate of reactant given the available cooling capacity or one can determine the required cooling for a desired process temperature or addition rate.
The next article will cover the actual runaway scenario (all-in EPI addition at 80°C) as seen by adiabatic calorimetry (VSP2), and its implication on relief system design. Furthermore, we will revisit the time-to-maximum-rate curve (derived from DSC screening of post-reaction mixtures) presented in the first article in this series to see where the ARC, VSP2, and the Thermal Activity Monitor (TAM) instruments detect the onset of secondary reactivity. Finally, we will modify the criticality class assessment of the process, if needed, given the additional data from the other instruments.
Reaction Calorimetry was performed in a Mettler-Toledo RC1.
If you have process scale up concerns or reaction calorimetry needs, please contact Don Knoechel at (knoechel@fauske.com or 630-887-5251) to discuss your process or contact us below: